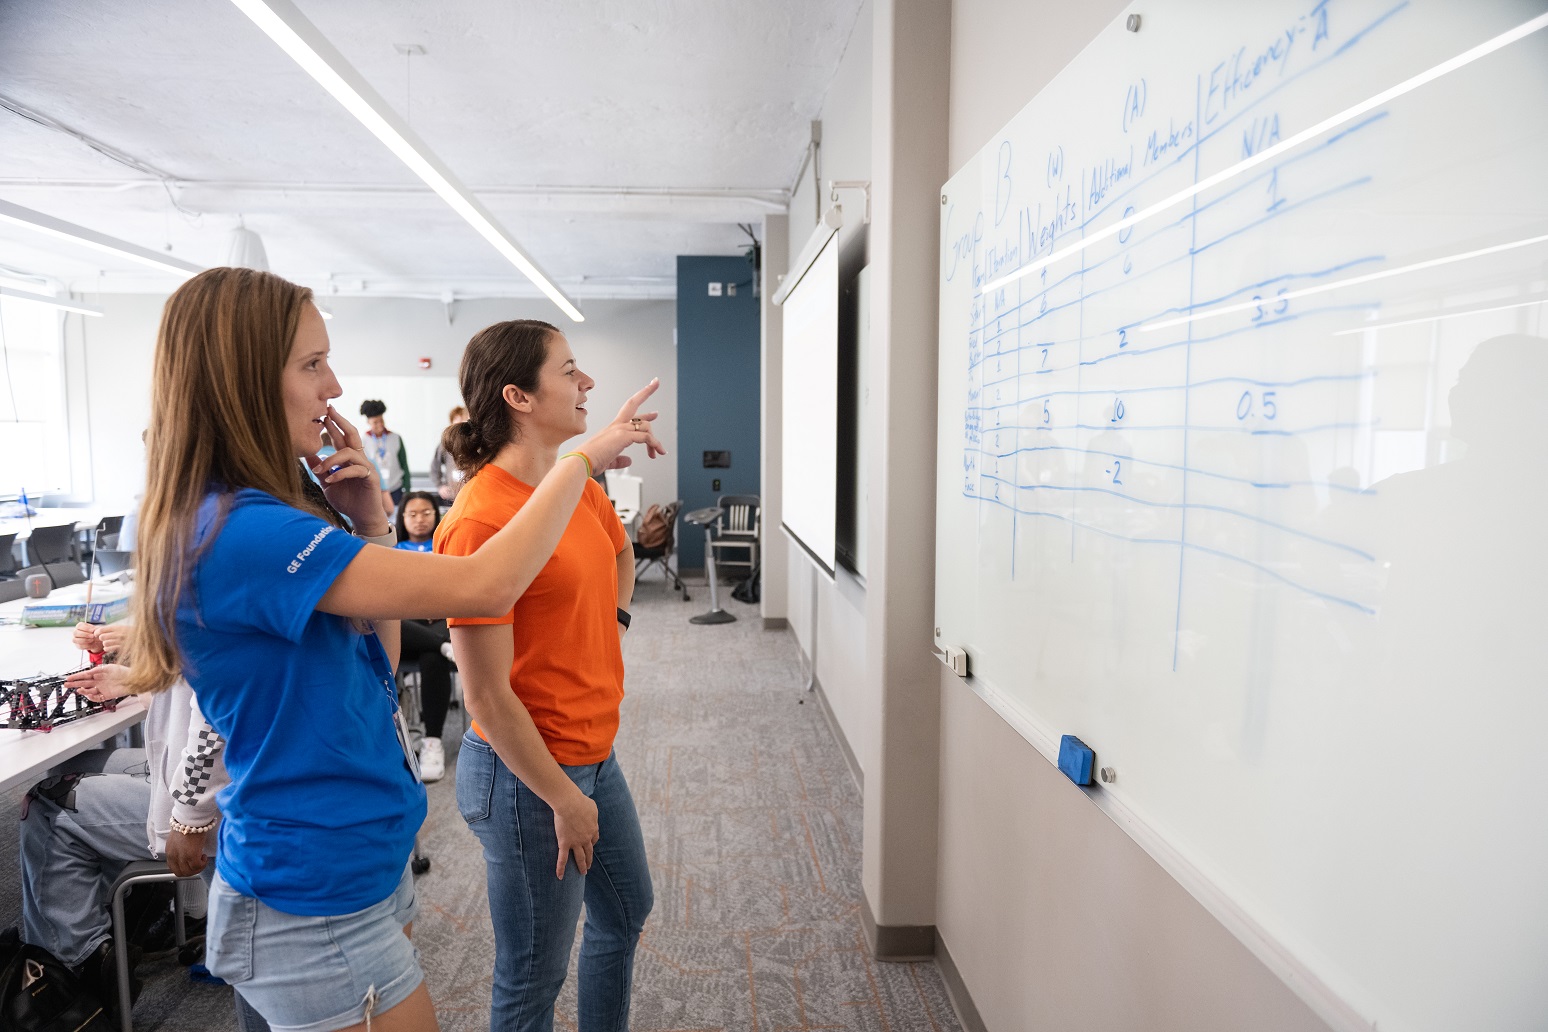
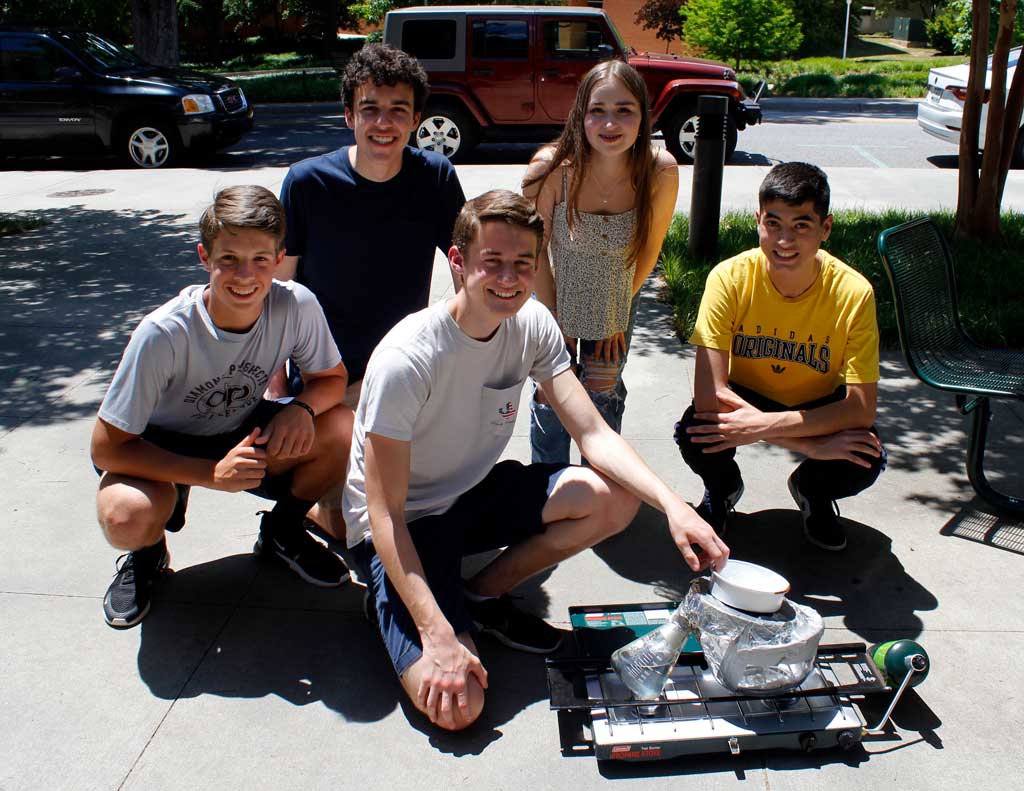
User account menu

  • Log in
Home Next Engineers
  • About
    • Our Program
    • Our Leadership
    • Volunteer
    • What Do Engineers Do?
    • Becoming an Engineer
    • FAQs
    Building a better world
    We are increasing the number of engineering innovators and leaders who will make what’s next for the world even better.
    Group of students
  • Programs
    • Engineering Academy
    • Engineering Camp
    • Engineering Discovery
    • Engineering at Home
    Driving change
    Inspiring the next generation of engineers to build a more creative, innovative, sustainable world.
    Engineering students
  • Locations
    • Bengaluru, India
    • Cincinnati, OH
    • Greenville, SC
    • Johannesburg, S.A.
    • New York Capital Region
    • Staffordshire, U.K.
    • Warsaw, Poland
    • Global Discovery
    GE businesses around the world are inspiring young minds
    Find city profiles, activities and how to join.
    Aim high
  • News
    Latest news & updates
    Read all news, updates, and happenings from the Next Engineers initiative.
    A group of students and teacher
  • Log in

Main navigation

  • About
    • Our Program
    • Our Leadership
    • Volunteer
    • What Do Engineers Do?
    • Becoming an Engineer
    • FAQs
  • Programs
    • Engineering Academy
    • Engineering Camp
    • Engineering Discovery
    • Engineering at Home
  • Locations
    • Bengaluru, India
    • Cincinnati, OH
    • Greenville, SC
    • Johannesburg, S.A.
    • New York Capital Region
    • Staffordshire, U.K.
    • Warsaw, Poland
    • Global Discovery
  • News
  • Log in

Cities navigation

GE businesses around the world are inspiring young minds
Find city profiles, activities and how to join.
Aim high

Inspiration navigation

Driving change
Inspiring the next generation of engineers to build a more creative, innovative, sustainable world.
Engineering students

News navigation

Latest news & updates
Read all news, updates, and happenings from the Next Engineers initiative.
A group of students and teacher

Resources navigation

Explore all resources
Find the tools that you need to run a successful Next Engineers program, including communication collateral and templates, student and volunteer outreach materials, student activity guides, engineering challenges, and Monitoring & Evaluation resources.
Two male engineering students at a table in a classroom smiling. Photo by Jeswin Thomas on Unsplash.
Building a better world
We are increasing the number of engineering innovators and leaders who will make what’s next for the world even better.
Group of students
Challenge Yourself
Find activity guides and resources to help you as students, parents, and teachers stay curious and build worlds that haven't even been thought of yet.
Challenge yourself
Measuring Impact
Partners and volunteers can explore real-time data on each Next Engineers program to see the difference they’re making in their communities.
Facilitator Amber showing the whitebaord
Flying High Banner Image
  • DIY
Flying High
Build It!
Ages Cost Time
14+ Low Half day
Download Student Guide
Download Volunteer Guide
Overview
Date and time

28th March 2026 at 9am EST | 1pm GMT | 2pm CET | 3pm SAST


Overview

Riverside International Airport (RTA) is a regional international airport serving both domestic and international flights. Passenger demand is growing, but the airport is already experiencing significant delays during peak periods.

You are part of an industrial engineering team contracted by the management to analyze current airport operational data, identify the most significant bottleneck(s), and propose system, process, flow, and/or layout changes to alleviate current congestion and possibly accommodate future expected demand.


This challenge is part of the Next Engineers: Engineering Academy Collaboration series of events.

have a think primary
Engineering Habits of Mind

This challenge will give you opportunities to practice all the engineering habits of mind, but especially problem-finding, systems thinking, and improving.

Your brief
Your brief

Your team has been asked to assist with the design of systems, processes, passenger flows, and internal terminal layouts to reduce current peak congestion and allow the airport to accommodate future expected capacity demands.

Below, you will find data about current capacity and operations that RTA has compiled for you. Use these data to:

  • Investigate current operations and identify the most important bottleneck(s).
  • Propose system, processes, flow, and layout changes that improve throughput and reduce peak congestion, bringing it in line with airport target wait times, while also accommodating expected future demand as far as possible.

You may make any reasonable assumptions where needed, so long as these are clearly stated and justified.

At the end of the time, you will present your proposals to the CEO of the airport. You may present your thinking in whatever form you choose. You will have 5 – 10 minutes for this presentation.

NOTE: Your task is NOT to design buildings or aesthetics, and you are not (re)designing the whole airport.

Get a head start
Get a head start

Because time on the day is limited, you and your team should try and make a start on the challenge if you can. Read through the operational data and start analyzing it to begin identifying the most significant bottleneck(s).

Airport operational data

The data below was compiled by the management team of RTA to assist you in your analysis.

Current passenger volumes

  • Annual passengers (departures, arrivals, transfers): 20 million
  • Peak months: July-August
  • Peak hour passengers: approximately 5,750 passengers/hour
  • Passenger mix:
    • 65% domestic
    • 35% international

Target passenger wait times

  • Domestic: 10 - 15 minutes
  • International: 20 - 30 minutes

Expected required capacity by 2034

  • 25 million passengers per year
  • 20% more international passengers
  • 15% more wide-body aircraft

Fixed constraints (non-negotiable)

  • Runways: 1 (no new runways are permitted)
  • Land footprint: 1.4 ha (0.45 ha available for development)
  • Safety & security: Must meet international aviation standards
  • Budget available: Low to moderate (no terminal expansion possible)
  • Accessibility: Must accommodate passengers with reduced mobility

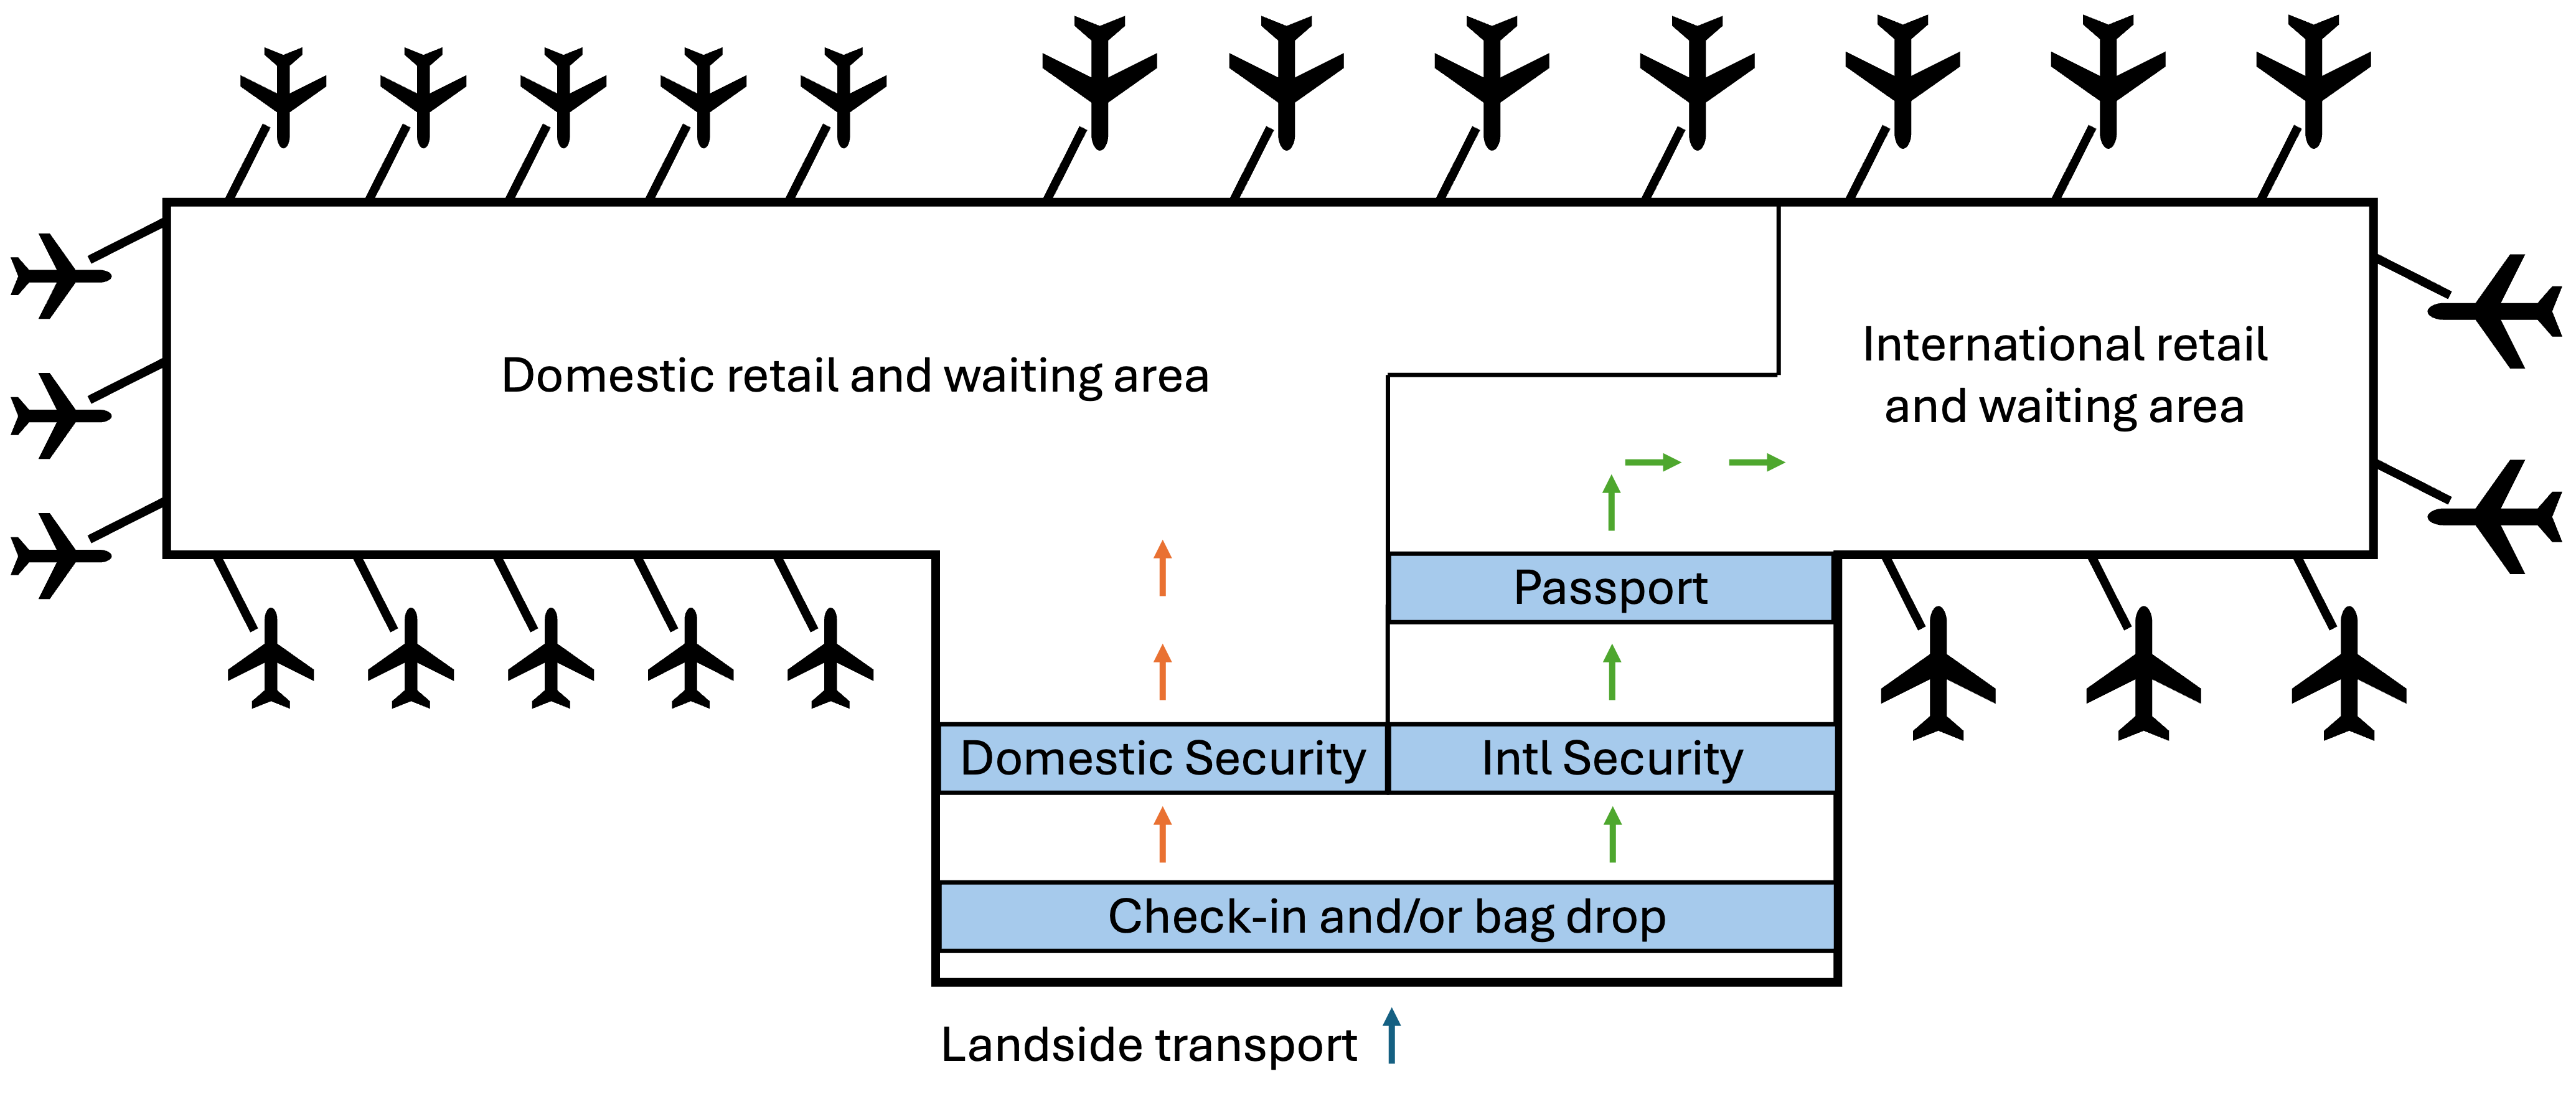
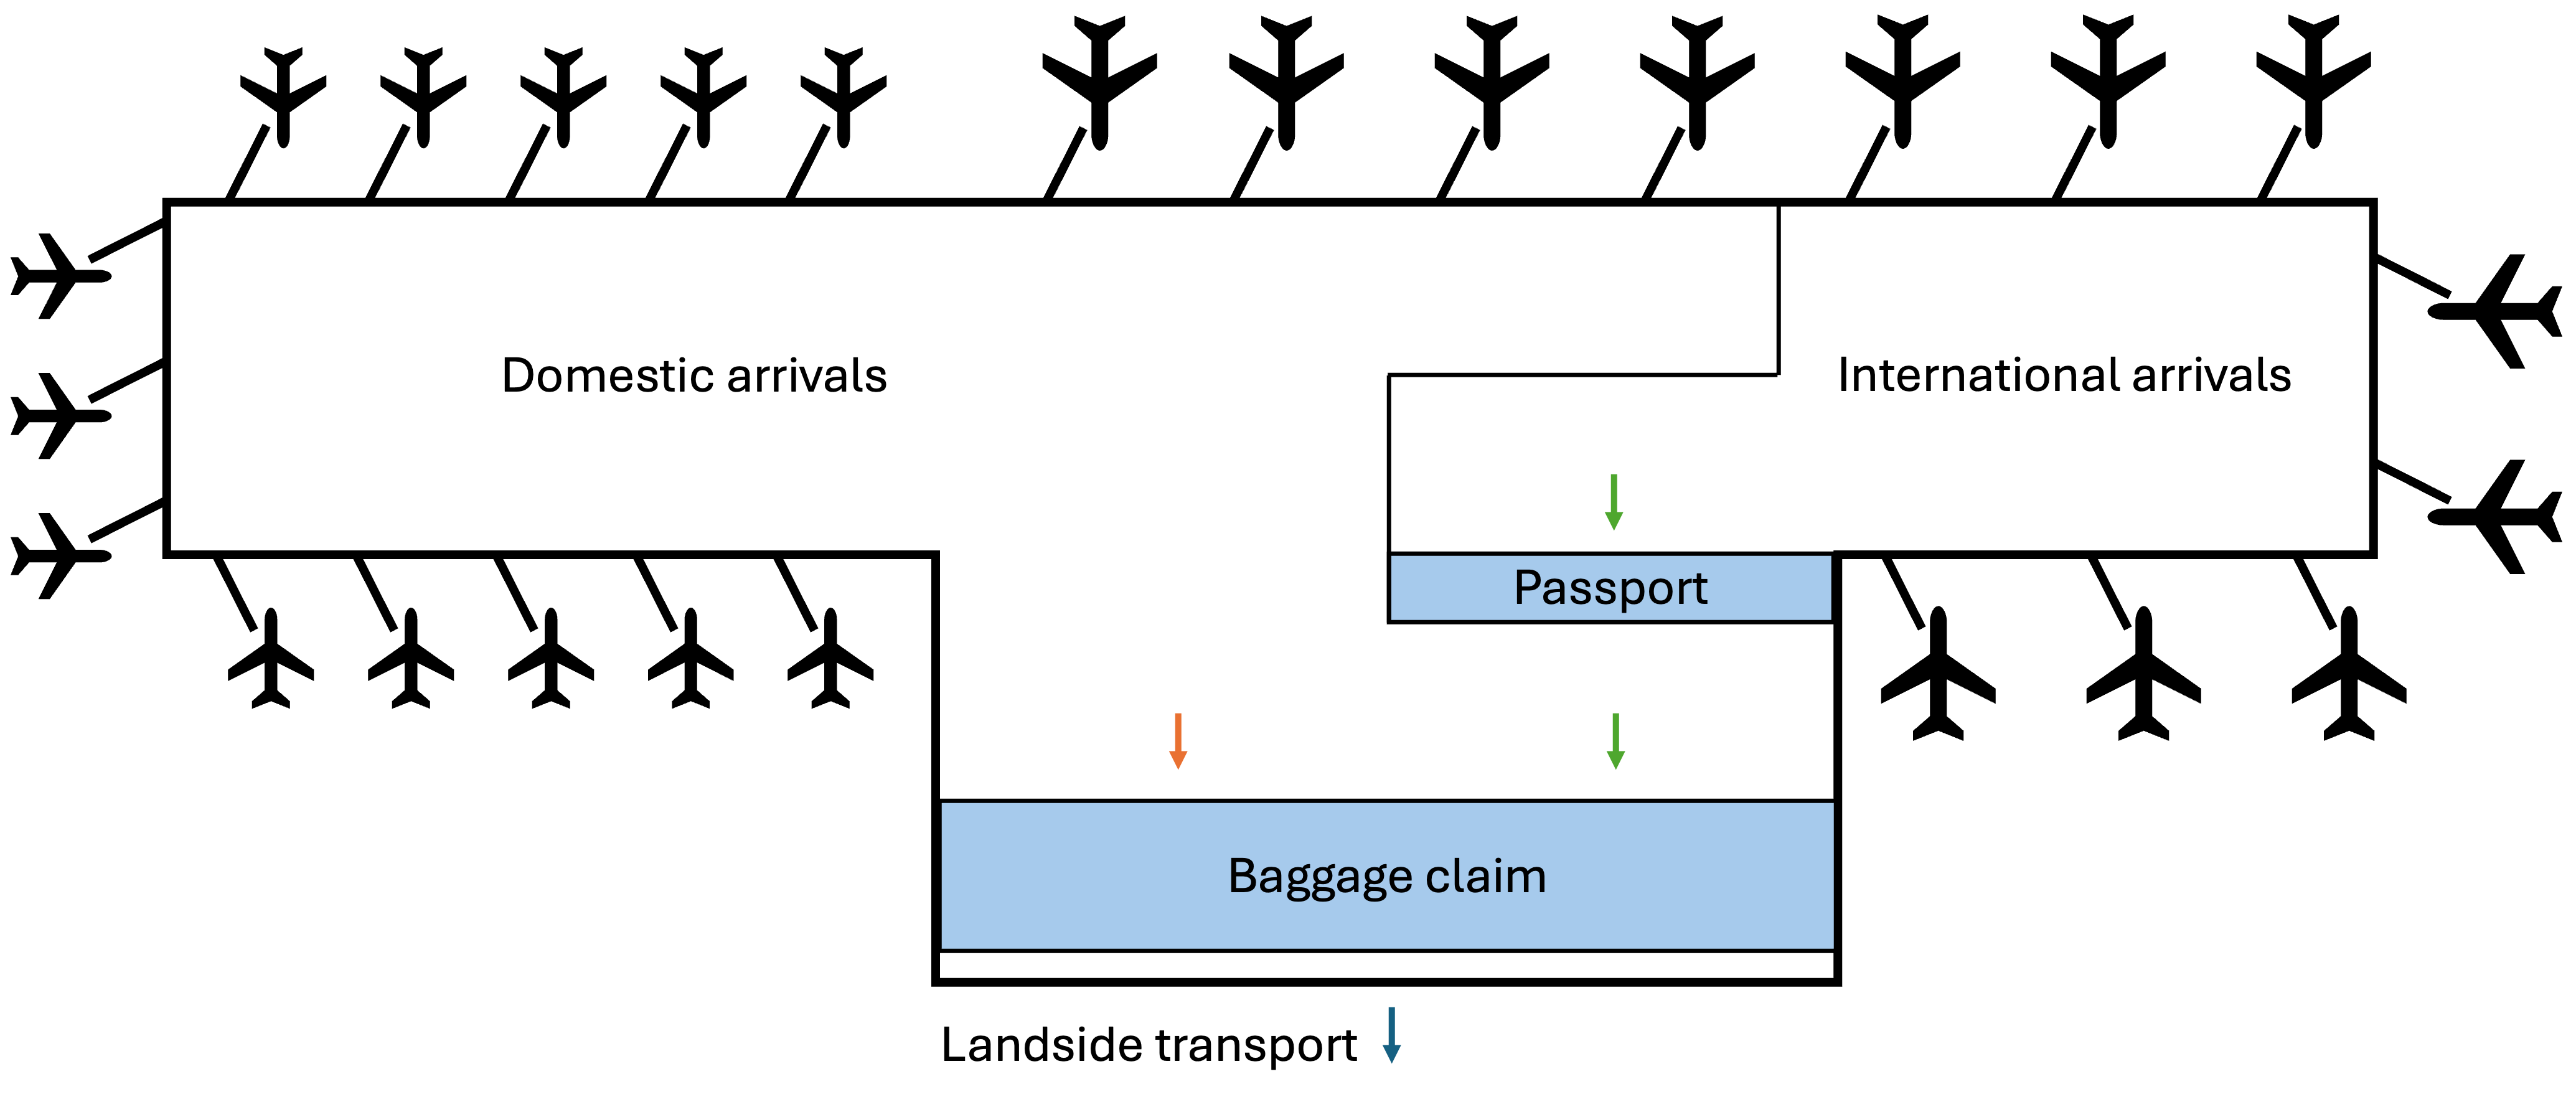
Typical passenger flow

  • Departing:
    • Arrive at airport (car, taxi, bus, rail)
    • Check-in and/or bag-drop
    • Security screening
    • Passport control (international only)
    • Retail / waiting area
    • Boarding at gate
  • International:
    • Aircraft arrival
    • Deplane at gate
    • Passport control (international only)
    • Baggage claim
    • Exit to landside transport

Key operational metrics

  • Operational hours:
    • First flight: 05:00
    • Last flight: 23:00
  • Security lanes: 18
    • Domestic: 13
    • International: 5
  • Passport lanes: 20 (staffed)
  • Gates: 25
    • Domestic: 17 (4 can handle wide-body aircraft)
    • International: 8 (all can handle wide-body aircraft)
  • Baggage carousels: 15
  • Passenger bags:
    • Domestic: 1.2 per person
    • International: 1.4 per person
  • Aircraft types serviced:
    • Narrow-body: 77%
    • Wide-body: 23%
    • Approximately 20% of domestic flights utilize wide-body aircraft
  • Aircraft passenger capacity:
    • Narrow-body: max 180
    • Wide-body: max 320
  • Average load factors (percentage of seats occupied):
    • Narrow-body: 80%
    • Wide-body: 85%
  • Average gate turnaround times (sequential turnaround)
    • Narrow-body: 50 - 55 minutes
    • Wide-body: 100 - 115 minutes
  • Aircraft movements (passenger flights only)
    • Movements per year: 110,300
    • Maximum stable annual movements: 130,000 - 150,000
Key terms
  • PASSENGER WAIT TIMES

    The length of time passengers need to wait before proceeding through an airport transition, e.g., check-in/bag-drop, security, or passport control.

  • SEQUENTIAL TURNAROUND

    All gate tasks are strictly done one after another (e.g., deplane then clean then refuel then board). This requires simple co-ordination, is stable and reliable, and reduces the number of ground-staff needed. But it is slow.

  • PARALLELIZED TURNAROUND

    At least some gate tasks are performed in parallel (e.g., clean and refuel). This requires more complicated co-ordination, is less stable and reliable, and increases the number of ground-staff needed. But it is faster.

  • AIRCRAFT MOVEMENTS

    Each landing and taxi to gate is 1 movement. Each taxi from gate and take-off is another movement.

  • Current airport layout

    Click on each image to see a larger version.

    Departure Level (Upper)
    Departure Level (Upper)
    RTA Departures (Upper Level) image
    Arrivals Level (Lower)
    Arrivals Level (Lower)
    RTA Arrivals (Lower Level) image
    What to do
    What to do

    Use the following step-by-step guide to help you think through the problem, interpret the data that you have, identify the assumptions you may need to make, and structure and justify your responses.

    Remember:

    • At the end of the challenge, you will present your recommendations/design proposals to the airport’s CEO. You may present your thinking in whatever form you choose. You will have 5 – 10 minutes for this presentation.
    • You are not (re)designing the whole airport.
    • You need to design and propose one or more well-reasoned and justifiable system improvements based on the data you have while making all your assumptions explicit.
  • Step 1: Explore current operations

    Use the data you have been provided to explore where current congestion issues are likely to occur and where the most significant bottleneck(s) exist. To do this, you will need to do some simple calculations.

    For example, if the current peak demand is 5,750 passengers/hour and this includes arriving and departing passengers, how many passengers do you expect the security checkpoint needs to deal with? What assumption(s) do you need to make? Refer to the Assumption bank below to check that your assumptions are realistic.

    Here are some possible bottlenecks you might investigate.

    • Security screening
    • Passport control
    • Aircraft turnaround time
    • Gate allocation conflicts
    • Baggage handling delays
  • Step 2: Define the current problem

    Choose what you consider are the most important bottleneck(s) to focus on. Make sure you have a well-reasoned justification for why you chose this bottleneck/these bottlenecks, making all your assumptions explicit. You will have to rely on the calculations you did and the assumptions you made to make this decision. Remember that you can choose more than one bottleneck to work on, if you like.

  • Step 3: Map the systems around the problem

    Dig deeper into your chosen bottleneck(s) by mapping the systems around them and identifying things like:

    • What other systems or processes might contribute to this bottleneck?
    • What other systems or processes may be affected by this bottleneck?
    • What flows through this part of the system (e.g., people, aircraft, baggage, information)?
    • What resources are needed and possibly shared with other systems (e.g., staff, space, equipment, time)?
    • What varies the most during peak periods?

    Once again, you might need to do some calculations and make some assumptions.

  • Step 4: Identify interactions and trade offs

    • What other parts of the airport system does this bottleneck affect?
    • If this bottleneck is improved, what new problem(s) might appear?
    • What trade-offs are inherent in this part of the airport process (e.g., cost vs speed, space vs flexibility, security vs flow)?
  • Step 5: Assumptions and uncertainties

    • What are the three most important assumptions you are making, the assumptions that, if they are wrong, will have the greatest effect?
    • What would you want to test or measure if you could ? These might form an important part of your final set of recommendations. When engineers are uncertain about something, they make this very clear.
    • How could your assumptions impact other areas, structures, and flows in the airport?
  • Step 6: Design proposal

    Based on your analysis of the existing bottleneck(s), what kind of interventions seem most promising? Indicate whether you believe your proposal serves as a short-term stabilization only or as a long-term capacity solution as well. This is another point at which doing some calculations would be helpful.

    For example, if you think adding new passport control lanes would be helpful, do the calculations that demonstrate what quantitative effect this will have. Check the Assumption bank including the section on Operational improvements to make sure that your proposals are grounded in reality.

    Here are some examples of the kinds of changes you could propose, but it is certainly not all of them.

    • A layout change
    • A process change
    • A scheduling / operations change
    • An information / communication change
    • A combination of the above

    Remember, you must be able to justify whatever design proposal(s) you make, again making sure that all your assumptions are explicit and reasonable.

  • Step 7: Success criteria

    What specific performance improvements can your design proposal(s) be expected to deliver? Do the calculations so that you can convince the CEO that your proposals will work. Some examples include:

    • Passengers per hour
    • Average wait time
    • Aircraft turnaround time
    • Reliability under peak load
    • Accessibility and inclusivity
  • Step 8: Future capacity check

    If you have not yet done this, explicitly examine whether your design proposal(s) is(are) sufficient to also meet expected future demand. You will probably need to do some calculations based on the passenger and aircraft demand estimates provided. For example, if peak demand rises at the same percentage as overall passengers, how would your proposals cope with this new demand?

    If not, what additional proposals could you make? What other bottleneck(s) are likely to emerge that will need to be addressed in the future?

  • Step 9: Prepare your presentation

    There is no set format for your presentation. You can create a PowerPoint presentation or other document if you wish. The most important thing is that you justify your proposals. This means you need to explain your thinking and describe how and why you arrived at your conclusions, including making all your assumptions explicit. For the CEO to take your recommendations seriously, they need to understand why you are making them and why they make sense.

    Here is a helpful checklist you can use to make sure that your presentation is as complete as possible:

    • Have you identified at least one primary bottleneck?
    • Are you able to justify your choice of bottleneck to focus on?
    • Have you included at least 4 – 5 relevant calculations based on the data provided?
    • Are all your assumptions explicit and are they reasonable and justified?
    • Where you have opted for very optimistic assumptions have you acknowledged the inherent trade-offs?
    • Have you explicitly tested the effects of your assumptions and identified when or where they might fail?
    • Have you compared conservative/reliable operations with optimized/fragile operations?
    • Have you recognized at least one trade-off or secondary effect of your proposals?
    • Have you identified any possible or emerging secondary bottlenecks or knock-on effects?
    • Have you done a future capacity check?
    • Have you acknowledged where your design proposals alone may not meet 2034 demand?
    • Have you made next-step recommendations?
  • Step 10: Present your proposals

    You have 5 – 10 minutes to present your recommendations. Thereafter, the CEO is likely going to want to ask you some questions and have you explain in more detail how you arrived at these conclusions.

    It is important that everyone on your team participates in the presentation.

  • Get calculating
    Get calculating

    The operational data you have been given, on its own, is not enough to do a proper analysis. You need perform some simple calculations to understand what is really happening in the airport.


    Queue time calculation

    If you know the demand for a service per hour and how many people that service can process in an hour, you can calculate the amount of time someone can expect to stand in the queue. See the example below.

    Assumption bank

    Passenger throughput and gate utilization

    The following are international benchmarks for airport passenger throughputs and gate utilization. There is no “right” value, but you should remain within these ranges so that your assumptions and proposals are anchored in reality. In most cases there is a trade-off between conservative but stable and reliable throughputs and highly efficient but fragile throughputs. You still need to justify all your assumptions.

    • Security screening throughput (per lane):
      • 120 passengers/hour/lane: conservative, very reliable
      • 140 passengers/hour/lane: typical mixed flow
      • 160 passengers/hour/lane: optimized, requires high passenger compliance, fragile
    • Passport control throughput (per lane staffed):
      • 35 passengers/hour/lane: conservative, very reliable
      • 40 passengers/hour/lane: typical mixed flow
      • 45 passengers/hour/lane: optimized, requires high passenger compliance, fragile
    • Passport control throughput (per lane self-service):
      • 70 passengers/hour/lane: conservative, very reliable
      • 85 passengers/hour/lane: optimized, fragile
    • Passenger compliance with guidance:
      • 60–70% comply: average compliance, reliable
      • 80–90% comply: high compliance, strong communication required, unreliable
    • Gate utilization targets:
      • 70–82%: robust and reliable
      • >83–90%: efficient but fragile

    Operational improvements

    You may not assume operational improvements from the following interventions beyond the ranges indicated. You still need to justify all your assumptions.

    • +5 – 10% throughput from staff cross-training
    • +10 – 15% throughput from passenger readiness measures
    • -5 – 10 minutes per aircraft via parallelized gate turnaround process
    • -5 – 10% peak demand via scheduling or information
    • -5 – 15% peak reduction from detailed scheduling information
    Key terms
  • PASSENGER WAIT TIMES

    The length of time passengers need to wait before proceeding through an airport transition e.g., check-in/bag-drop, security, or passport control.

  • SEQUENTIAL TURNAROUND

    All gate tasks are strictly done one after another (e.g., deplane then clean then refuel then board). This requires simple co-ordination, is stable and reliable, and reduces the number of ground-staff needed. But it is slow.

  • PARALLELIZED TURNAROUND

    At least some gate tasks are performed in parallel (e.g., clean and refuel). This requires more complicated co-ordination, is less stable and reliable, and increases the number of ground-staff needed. But it is faster.

  • AIRCRAFT MOVEMENTS

    Each landing and taxi to gate is 1 movement. Each taxi from gate and take-off is another movement.

  • Queue time calculation
    Queue time calculation

    Calculating expected queue times based on how many passengers (pax) arrive at a point per hour and how many passengers can be processed per hour is simple to do. Here is an example.

    • Peak passengers: 800 pax/hr
    • Capacity: 15 lanes
    • Throughput: 35 pax/hr/lane

    Service rate = 15 lanes x 35 pax/hr/lane = 525 pax/hr

    Arrival rate = 800 pax/hr

    Utilization = arrival rate / service rate = 800/525 = 1.5

    A utilization greater than 1 indicates an unstable queue. In other words, the time to process one hour’s arrivals is greater than one hour. In this case, it would take 1.5 hours. If high volumes persisted, queues would get longer and longer until the arrival rate falls below the service rate.


    See All Activities
    Connect

    Want to know more or how to get involved? Are you an aspiring engineer or do you know one? We want to hear from you. Send us your questions and follow us on social media:

    Contact us: NextEngineers@fhi360.org

    Follow GE Aerospace
    Instagram LinkedIn X YouTube

    Follow GE VERNOVA
    Instagram LinkedIn X YouTube
    A groups of students

    Footer menu

    • Home
    • About
    • Inspiration
    • Cities
    • News

    Footer secondary

    • Terms of use
    • Privacy Policy
    • Cookie Policy
    • Research Study Notice
    • Next Engineers Privacy Notice
    • GE Aerospace
    • GE Vernova
    © 2026 FHI360